The rules of paid search have shifted dramatically, and the advertisers who fail to notice are quietly bleeding budget. Google Ads in 2026 is not the same platform it was two years ago, and the gap between those who understand the data and those who simply follow old assumptions has never been wider.
If you have run Google Ads campaigns before, you already know the basics. But knowing the basics is no longer enough. Algorithm updates, AI-driven bidding changes, and evolving user behavior have reshaped what actually drives performance. The metrics that once signaled success may now be masking serious inefficiencies.
This analysis cuts through the noise and focuses on what the numbers genuinely reveal about campaign performance, audience behavior, and return on ad spend in the current landscape. You will walk away with a clearer picture of which strategies are delivering results, which are losing ground, and how to position your campaigns based on evidence rather than assumptions. If you want to make smarter, more confident decisions with your paid search budget, this is where that process starts.
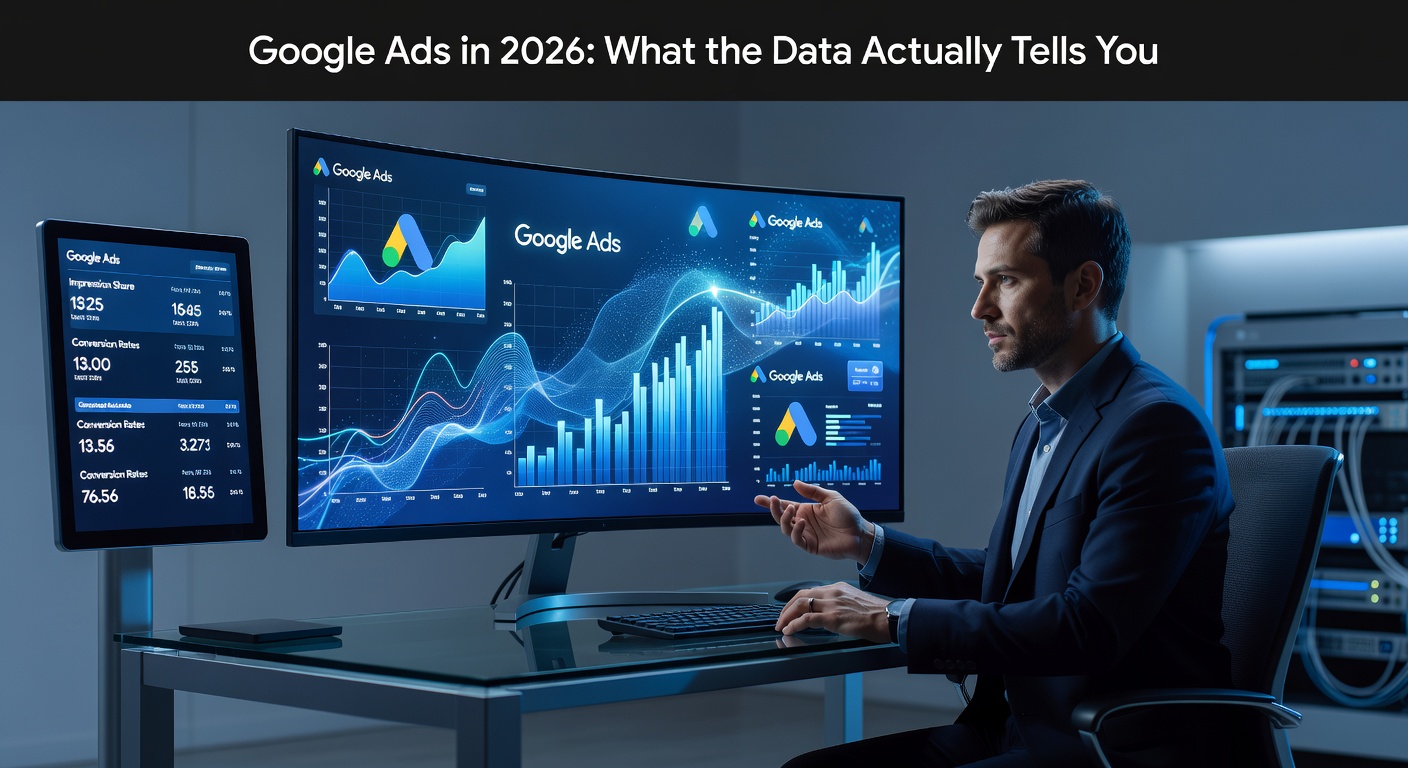
The Google Ads Landscape in 2026
Google's position in the global search landscape is not merely dominant; it is structurally defining. According to StatCounter's global search engine market share data, Google holds approximately 89.85% of global search traffic across all devices as of 2026. In Australia, that figure climbs even higher. Research into Google's Australian search market share confirms Google commands 94%+ of local search queries, spanning desktop at 93.2% and mobile at 94.8%. For Australian businesses, this is not a channel among many; it is the default entry point for high-intent consumers actively searching for products, services, and solutions.
The financial scale behind this dominance is equally striking. Alphabet reported $82.3 billion in advertising revenue in Q4 2025 alone, representing 14% year-over-year growth from $72.5 billion in Q4 2024. Google Search and its related properties drove $63.1 billion of that figure, a 17% increase. Projections place total Google Ads revenue at approximately $318 billion for full-year 2026, reflecting sustained growth fueled by AI enhancements and expanding advertiser adoption globally.
The platform's AI transformation is already deeply embedded in the market. Over 1 million advertisers now run Performance Max campaigns, the AI-automated campaign type that manages bidding, targeting, and creative across Search, Shopping, YouTube, Display, and Discover simultaneously. In May 2025, Google launched AI Max for Search, extending AI-driven automation directly into core search campaign management with dynamic query matching, creative personalization, and intelligent audience expansion built in.
For Australian businesses evaluating whether to invest in Google Ads, the competitive reality is unambiguous. Choosing not to participate is not a neutral position; it means competitors are actively bidding on the keywords, audiences, and placements your customers are engaging with daily. In a market where Google captures 94 cents of every search dollar spent, absence from the platform is effectively a concession of intent-driven demand to rivals who show up.
Google Ads Benchmarks That Actually Matter in 2026
Based on WordStream's 2026 Google Ads benchmarks report, which analysed over 13,000 US search campaigns running from April 2025 to March 2026, the average click-through rate for Google Search Ads sits at 6.64%. This figure serves as a practical diagnostic baseline. If your account is consistently delivering CTRs below 4-5%, the problem is rarely the platform itself; it typically points to weak ad copy, poor keyword-to-intent alignment, or insufficient ad relevance. Industries like Arts and Entertainment outperform significantly at 12.75%, while Dentists and Dental Services trail at 5.66%, which illustrates how vertical context shapes what "good" actually looks like.
The average CPC of $5.42 USD tells a similarly nuanced story. That headline number stabilised year-over-year, but it masks extreme variation at the vertical level. Attorneys and Legal Services average $9.87 per click, while Arts and Entertainment sits at just $1.63. For Australian advertisers, the pressure is compounded further; some local verticals have seen year-over-year CPC increases of roughly 13%, and the long-term trajectory is stark. CPC has more than doubled since 2016, when the average was $2.32. Understanding where your industry sits on that spectrum is not a secondary consideration; it is the foundation of any credible budget allocation decision.
Conversion rates present a more encouraging picture. The current aggregate average across industries sits at 8.18%, up from 7.52% in the prior benchmark period, with improvements recorded across 87% of industries. However, accounts falling below 3-4% require immediate attention. At that level, the issue is almost never the ads themselves. The breakdown typically occurs post-click, in the landing page experience, messaging consistency, or offer clarity. A disciplined funnel audit is the correct first response, not an increase in ad spend.
Perhaps the most significant data point from the latest benchmark findings is the decline in average cost per lead to $66.69, down from $70.11 in the previous period. This marks the first CPL decrease in five years, and it signals something meaningful: AI-driven optimisation tools, including Smart Bidding and intent-based matching, are beginning to generate efficiency gains that offset rising competition in several sectors. For advertisers who have invested in proper conversion tracking, first-party data infrastructure, and funnel alignment, that efficiency dividend is becoming measurable. Those who have not built those foundations are likely still absorbing the cost increases without capturing the upside.
What Google Ads Actually Costs Australian Businesses
Australian SMEs operate in a paid search environment that looks meaningfully different from the US benchmarks covered in the previous section. According to Australian digital marketing industry reports, mid-tier and competitive businesses typically allocate between AUD $5,000 and $20,000 per month in Google Ads spend, excluding agency management fees that commonly add another $800 to $2,000 per month or 10 to 20% of spend on top. CPCs across that spend range vary enormously by vertical. Lower-competition terms in retail or general services can sit near AUD $2, while finance, legal, and competitive B2B professional services keywords routinely reach AUD $13 or higher, with some legal niches pushing well beyond that ceiling.
The reason Australian advertisers cannot simply redirect this budget to an alternative platform comes down to market structure. Google holds over 94% of the Australian search market across desktop and mobile, a figure that effectively eliminates any meaningful substitution. When a Sydney-based professional services firm needs to capture high-intent, in-market search demand, Google Ads is not one option among many; it is structurally the only option at scale.
Rising CPCs across competitive Australian verticals are reshaping how budget efficiency is achieved. Bid strategy alone no longer provides a reliable edge when competitors are bidding equally aggressively. The levers that actually move the needle are Quality Score, landing page experience, and post-click conversion rate. Google's own documentation confirms that advertisers with Quality Scores of 8 or above receive meaningful CPC reductions relative to competitors with weaker scores, which means creative relevance, page speed, and message alignment directly reduce what you pay per click.
Australian advertisers also need to build locally calibrated budget models rather than importing US figures directly. GST adds 10% to both ad spend and management fees. The addressable audience is structurally smaller than the US, limiting scale. And as Australian CPC benchmark data confirms, local competitive verticals can match or exceed US average CPCs in certain niches, making direct benchmark translation unreliable.
The practical consequence is stark. In a competitive Sydney B2B vertical where CPCs sit at AUD $20 or above, a $10,000 monthly budget may deliver fewer than 500 clicks. At that volume, the ad itself becomes almost secondary; the primary ROI lever is what happens after the click. Landing page conversion rate, offer clarity, and follow-up sequencing determine whether that spend produces pipeline or simply generates traffic data. This is precisely why funnel architecture and post-click experience must be treated as core components of any Google Ads strategy, not afterthoughts bolted on once campaigns are live. As covered in this breakdown of Google advertising costs, understanding the full cost structure before launching is what separates campaigns that compound from those that simply spend.
AI Automation and Performance Max: Opportunity or Black Box
Performance Max campaigns represent the most significant structural shift in Google Ads since automated bidding was introduced. With over one million advertisers now running PMax campaigns, Google's AI takes broad control across the entire ecosystem, including Search, Display, YouTube, Gmail, Discover, and Maps, dynamically selecting placements, assembling creative combinations from asset pools, and expanding audiences based on intent signals. The appeal is real: some analyses have reported average CPA reductions of approximately 18% compared to standard channel-siloed campaigns when PMax is properly configured. The critical qualifier in that sentence is "properly configured."
The Input Quality Problem
PMax and its companion feature, AI Max for Search, do not operate in isolation from human decisions. They amplify whatever inputs they receive. AI Max for Search extends this automation logic into traditional search campaigns, dynamically adjusting keyword matching beyond conventional match types and generating creative variations in real time based on query intent signals. Dynamic Search Ads began transitioning to AI Max from around September 2026, meaning this shift is no longer optional for many accounts. The practical consequence is that manual keyword control is reduced, and the AI leans harder on the conversion signals and audience data you have already provided.
This is where the "black box" criticism has genuine merit. When conversion tracking is misconfigured, for example tracking low-value micro-conversions like page views instead of purchases, or when campaign volume falls below the recommended 50 conversions per month needed for Smart Bidding to stabilise, the algorithm optimises confidently toward the wrong outcome. It spends efficiently toward a signal that does not represent business value. Research into common PMax underperformance patterns consistently shows that the AI is rarely the root cause; the setup is.
Rich Inputs Versus Minimal Setup
The performance gap between well-structured and poorly structured PMax campaigns is significant. Advertisers who supply Customer Match lists with segmented first-party data, multiple asset variations per group covering distinct benefits, calls to action, and social proof elements, alongside clean high-value conversion events tied to actual revenue, consistently outperform those who launch with minimal assets and expect the algorithm to self-correct. Asset group segmentation by product category, margin tier, or acquisition objective gives the AI clearer directional guidance during its learning period, which typically spans six to eight weeks.
Controls That Are Non-Negotiable
Several features exist specifically to prevent the automation from working against your account. Brand exclusions prevent PMax from cannibalising branded search terms that would have converted organically or through cheaper brand campaigns, and unmanaged brand spend inflation of 8 to 15% has been documented in accounts without these exclusions applied. URL expansion controls and final URL exclusions stop the AI from sending traffic to irrelevant pages. Search term transparency reporting, significantly improved through 2025 and 2026 updates, allows advertisers to audit what queries are actually triggering spend. According to PMax best practices analysis for 2026, the era of the pure black box is closing, but only for advertisers actively using these controls.
Treating PMax as a hands-off campaign type is the most common and costly mistake in modern Google Ads management. The automation is genuinely powerful when guided by accurate conversion data, diverse creative assets, and structured account controls. Without those foundations, the algorithm will spend confidently and deliver little of substance.
How AI Overviews Are Changing Google Ads Performance
Google AI Overviews have moved from experimental feature to structural reality across Australian and global search results. By 2025, AIOs were appearing on a significant proportion of queries in Australia across both mobile and desktop, sitting above organic listings and, in many cases, above paid placements. For advertisers who built their Google Ads strategy around predictable SERP positions, this shift is not a minor adjustment; it fundamentally changes how impression share translates into actual clicks.
The SERP real estate compression effect is measurable and significant. A Seer Interactive study analysing over 25 million organic impressions and 1.1 million paid impressions found that for queries triggering AI Overviews, paid CTR dropped approximately 68%, falling from 19.7% to 6.34%. Organic CTR fell 61% on the same queries. The critical finding here is that impression share can remain stable while click volume collapses, because users are reading the AI-generated summary and exiting without scrolling to the ads positioned below it. For advertisers monitoring impression share as a health metric, this disconnect is a serious blind spot.
The queries most affected are those with informational framing but transactional undertones, the kind that previously bridged awareness and purchase intent. Someone searching "best accounting software for small business" may now receive a fully synthesised comparison within the AIO, reducing their motivation to click through to a paid listing. Research into how AI Overviews are reshaping CTR dynamics also highlights that brands cited within AIOs see substantially higher CTRs, with paid CTR approximately 91% higher for cited brands compared to non-cited competitors. This turns content authority into a direct paid performance lever.
For advertisers running asset-rich campaigns with structured ad assets, product feeds, and diverse creative, there is a meaningful upside. Google has confirmed that ads from Search, Shopping, and Performance Max campaigns can appear within or adjacent to AI Overviews on eligible queries, particularly those with commercial intent. Campaigns with strong relevance signals, high-quality images, and well-structured data are better positioned to earn these placements.
The correct strategic response is to tighten campaign focus around high-intent, transactional queries where AIO prevalence is lower, while simultaneously building content that earns organic citations inside the overviews themselves. Pulling back spend broadly would cede ground to competitors who adapt. The more precise move is to ensure every dollar is working on queries where user intent is strong enough to drive clicks regardless of the AI layer sitting above the results.
Measurement, Attribution, and First-Party Data in 2026
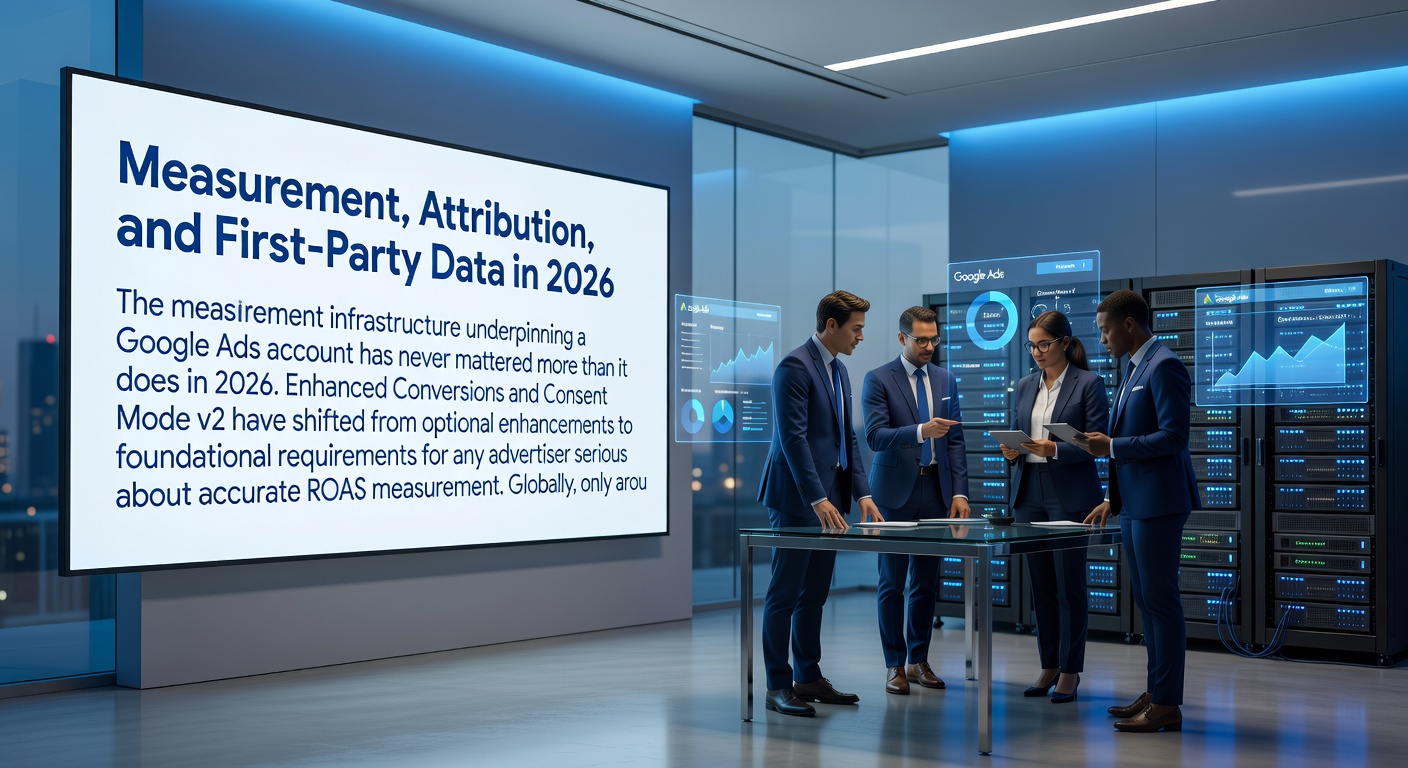
The measurement infrastructure underpinning a Google Ads account has never mattered more than it does in 2026. Enhanced Conversions and Consent Mode v2 have shifted from optional enhancements to foundational requirements for any advertiser serious about accurate ROAS measurement. Globally, only around 31% of users accept tracking cookies on average, meaning basic conversion tags are systematically blind to the remaining 69% of conversion activity. For Australian advertisers, the practical consequence is straightforward: accounts still running standard Google tags without Enhanced Conversions or Consent Mode v2 are making budget and bidding decisions based on structurally incomplete data, not edge-case gaps.
Enhanced Conversions address this by sending hashed first-party signals, such as email addresses captured at checkout or form submission, back to Google, enabling matching against signed-in Google users even when cookies are absent or blocked. Implementations achieving 50% or more of conversions enhanced typically see 5 to 25% uplift in reported conversions, recovering journeys that would otherwise go dark. Consent Mode v2, running in advanced mode, enables Google's conversion modeling to statistically reconstruct non-consenting user behaviour from consented patterns, often delivering an additional 10 to 30% recovery in reported conversion volume. Together, these two implementations represent the minimum viable measurement standard in 2026.
Attribution Gaps Are Distorting Performance Reporting
Cookie deprecation across Safari and Firefox, combined with Apple's App Tracking Transparency framework, has fractured the conversion journeys that last-click attribution was built to handle cleanly. When a user clicks a Google ad on mobile, continues research on a desktop browser, and converts three days later, standard Google Ads reports frequently credit zero contribution to the original click. Industry analysis suggests roughly 24% of conversions go untracked due to cross-device attribution failures alone. The result is that direct-click contribution is systematically overstated while assisted conversions, particularly upper-funnel touchpoints, are understated or invisible.
First-Party Data and Offline Conversion Import
First-party data fed back into Google Ads, specifically CRM lists, Customer Match audiences built from hashed email uploads, and segmented purchase value tiers, gives Smart Bidding real revenue signals rather than proxy behavioural indicators. The algorithm performs materially better when it can distinguish between a high-value returning customer and a low-intent browser. For Australian service businesses operating with longer sales cycles, B2B consultations, and multi-week decision timelines, offline conversion import closes the loop that web-only tracking cannot. Uploading CRM deal-close data linked via click IDs connects actual revenue outcomes back to the campaigns and keywords that generated them, consistently improving CPL accuracy and bidding quality for accounts that implement it correctly.
The compounding risk of ignoring this infrastructure is significant. When AI-driven bidding optimises against incomplete or noisy conversion data, reported platform metrics can show apparent improvement while actual business revenue stagnates. The account looks healthy; the business does not grow. A clean measurement foundation is not a technical afterthought; it is the precondition for every AI and automation feature in the Google Ads ecosystem to function as intended.
Why Creative Quality and Funnel Alignment Now Drive ROI
As AI increasingly manages bidding strategies, audience targeting, and auction mechanics inside Google Ads, the levers that remain firmly in human hands are creative quality and funnel alignment. This is not a minor tactical observation; it represents a fundamental reordering of where advertiser effort produces returns. Headlines, descriptions, images, and video assets are now the primary differentiators between campaigns that compound performance and those that plateau despite healthy budgets and technically sound account structures.
Creative Inputs That Actually Move Performance
Responsive Search Ads surface this dynamic clearly. Google's own data indicates that improving Ad Strength from "Poor" to "Excellent" correlates with approximately 15% more conversions on average. However, the mechanism behind that improvement matters more than the rating itself. RSAs with low Ad Strength typically suffer not from missing slots, but from repetitive messaging: slight variations of the same value proposition across multiple headlines that give Google's system limited combinations to test. Filling all 15 headline and four description slots with genuinely distinct selling points, specific proof elements, and intent-matched language gives the algorithm meaningfully different material to optimise across query types. Advertisers who treat RSA creation as a copy exercise rather than a messaging strategy consistently leave performance on the table.
Where Australian Budgets Quietly Leak
The post-click experience is where a disproportionate share of Australian Google Ads spend produces no return. Qualified traffic arrives after a precisely targeted ad, then lands on a generic homepage that restates the brand rather than continuing the specific conversation the ad started. Page load speed compounds the problem: pages failing Core Web Vitals thresholds, particularly Largest Contentful Paint beyond 2.5 seconds, hurt Quality Score, increase effective CPC, and reduce conversion rates simultaneously. Improving landing page conversion rate from 2% to 3% reduces cost per acquisition by approximately 33% without any increase in ad spend. That arithmetic makes post-click optimisation one of the highest-return investments available to mid-budget advertisers.
Message Consistency as a Compounding Advantage
Message consistency, running from keyword intent through ad copy to landing page headline to the call-to-action, is the single highest-leverage optimisation most mid-budget advertisers have not fully implemented. The breakdown is usually subtle: an ad that promises a specific outcome lands on a page that speaks to a broader audience, softening the commitment and triggering doubt at precisely the moment conversion should occur. Tight message match removes that friction and builds the transactional confidence required for action.
Critically, funnel alignment is not a configuration task completed at campaign launch. It requires ongoing review of search term reports to surface emerging intent patterns, heatmap and scroll data to identify where post-click engagement collapses, and conversion path analysis segmented by ad group and creative to locate where the journey breaks. These inputs feed back into messaging adjustments, dedicated landing page variants, and negative keyword refinements that progressively close the gap between traffic quality and conversion rate. Campaigns managed with this diagnostic discipline consistently outperform those optimised purely within the ad platform.
Google Ads as a Data Engine, Not Just an Ad Platform
Most advertisers measure Google Ads success by a single metric: return on ad spend. That framing is limiting, because it treats the platform purely as a cost centre rather than what it actually is at a systems level, a commercially validated data engine that generates signal no other source can replicate at scale.
Search term reports are the clearest example of this. When a query triggers an ad click that converts into a lead or sale, that query has passed the highest possible commercial validation test. It is not a keyword with estimated search volume; it is a phrase a real buyer used to find a solution and then acted on. Feeding those high-converting terms directly into an SEO content strategy means prioritising topics with demonstrated demand, not theoretical demand. The content calendar stops being a creative exercise and starts being informed by buyer behaviour. This is a structural advantage that only advertisers running active campaigns can access.
The same logic applies to audience data. Customer Match lists, remarketing pools, and converter-based segments built inside Google Ads represent your highest-value cohorts by definition. Those segments do not have to stay within Google. Uploading converter lists to LinkedIn via Matched Audiences enables precise retargeting and account-based targeting among the decision-makers most likely to buy, because the segment is defined by prior conversion behaviour rather than inferred interest. The paid search budget effectively subsidises the audience intelligence used across every other channel.
Ad copy is another underused data asset. Responsive search ads and Performance Max asset groups run continuous creative testing, surfacing which headlines and calls to action generate clicks and conversions under real competitive conditions. Those winning variants are validated messaging. Migrating them into landing page headlines, email subject lines, and LinkedIn post hooks removes guesswork from the rest of the funnel. The testing budget has already been spent; the insight should compound across every touchpoint.
The common thread across all three is that advertisers running Google Ads as a siloed spend channel extract only a fraction of available value. The signal generated by paid search, the queries, the converters, the copy, should flow back into content, CRM, and organic strategy. Each channel then improves the others: SEO reduces long-term paid dependency, refined audiences improve LinkedIn conversion rates, and validated messaging increases email performance.
This is the architecture of a systems-based growth approach. Google Ads generates high-intent signal. SEO captures compounding organic demand from that signal over time. LinkedIn builds authority with the specific decision-makers the data identifies. The funnel converts across all entry points with messaging already proven under paid conditions. Analytics ties the full picture together, attributing value across touchpoints rather than crediting a single channel. Businesses that build this system do not just run better ads; they build a marketing operation where each investment compounds the returns of every other.
A Practical Framework for Auditing Your Google Ads Account
An audit is only as valuable as the framework behind it. Rather than a surface-level review of clicks and spend, a structured Google Ads audit works through five interconnected layers, each of which directly influences how well the platform's AI systems can optimise on your behalf.
Conversion Tracking Integrity
The audit starts with measurement, because everything downstream depends on it. Verify that Enhanced Conversions are active and passing hashed first-party data (email addresses, phone numbers from form submissions) back to Google. Confirm that Consent Mode v2 is configured in Advanced mode, enabling Google to model conversions from users who decline tracking consent. Without this, AI bidding strategies are operating on incomplete data, and your reported ROAS may be materially understated. Critically, audit what your conversion actions are actually measuring. Page views, time on site, and scroll depth are proxy events, not business outcomes. Conversion actions should reflect qualified leads, sales, booked appointments, or substantive enquiry submissions, with values assigned where possible to enable value-based bidding.
Campaign Structure and Intent Alignment
Structure is where budget efficiency is won or lost. Review whether high-intent, bottom-of-funnel terms are isolated in dedicated ad groups with tailored landing pages, or whether they are competing within broad campaigns alongside informational queries. A user searching "hire Sydney marketing consultant" has fundamentally different intent from someone searching "what does a marketing consultant do," yet poorly structured accounts routinely serve both from the same campaign. This dilutes Quality Scores, drives up CPCs, and sends transactional traffic to generic landing pages that cannot convert at a competitive rate. Intent-based segmentation ensures that messaging, bidding, and destination pages are aligned to where the user sits in the funnel.
Asset Quality and Creative Differentiation
Across both Performance Max asset groups and Responsive Search Ads, check Ad Strength ratings and the diversity of creative inputs. Multiple headline and description variations, several image aspect ratios, and at least one video asset give Google's AI the raw material it needs to optimise across placements. More importantly, audit the quality of the messaging itself. Generic statements such as "trusted service" or "competitive pricing" are indistinguishable from competitor copy and contribute nothing to differentiation. Asset groups should contain specific proof points, concrete offers, and clear value propositions that reflect an actual reason to choose your business.
Negative Keyword Hygiene
Search term reports remain one of the highest-leverage areas in any AI-managed account. Broad match expansion and Performance Max's automated targeting consistently generate impressions on irrelevant or low-intent queries, and without active negative keyword management, a meaningful share of budget is absorbed by traffic that was never going to convert. Filter search term reports for the past 30 to 90 days and look for patterns: competitor brand names, job-seeking queries, unrelated product categories, and informational keywords that belong in a content strategy rather than a paid campaign.
Benchmarking Against Industry Standards
The final layer is benchmarking. According to WordStream's 2026 analysis of over 13,000 campaigns, the average Google Ads CTR sits at 6.64% and the average conversion rate at approximately 8.18%. An account running a 2% CTR and 3% conversion rate in that same vertical does not have a minor performance gap; it has a quantifiable optimisation opportunity across every layer above. That gap represents wasted spend, underperforming structure, weak creative, or tracking degradation, and each shortfall maps directly to a corrective action. Benchmarking converts vague dissatisfaction with account performance into a prioritised roadmap with measurable targets at each stage.
The Bottom Line on Google Ads in 2026
Google Ads remains the highest-intent paid channel available to Australian businesses, and that position is not under threat. What has changed fundamentally is what it takes to extract consistent ROI from the platform. AI automation, the expansion of AI Overviews into Australian search results, and sustained CPC inflation across competitive verticals have collectively made tactical campaign management insufficient as a standalone approach. Adjusting match types, tweaking bids, and refreshing ad copy no longer moves the needle the way it once did.
ROI in 2026 is determined by four interconnected factors working together: clean measurement infrastructure that feeds the algorithm accurate signals; high-quality creative assets that differentiate in an increasingly automated auction environment; post-click funnel alignment that converts the intent captured at the ad level; and the discipline to treat paid search data as strategic signal rather than siloed campaign output. Weakness in any one of these areas limits the performance of the other three.
For businesses currently spending AUD $5,000 or more per month without a structured audit, verified attribution, and a clear funnel review process, the budget is almost certainly underperforming relative to its potential. In an AI-driven environment, misconfigured tracking does not simply produce inaccurate reports; it actively directs the algorithm toward the wrong outcomes, compounding waste at scale.
The most systematic path forward is the one that starts with diagnosis before optimisation. Anthony Ligyat's four-phase methodology, built around diagnosing funnels, auditing issues by impact, building AI-assisted production systems, and compounding performance through data, provides a structured sequence for moving from reactive spend to durable growth.
The single most actionable step available right now is a conversion tracking audit. Before touching bids, budgets, or campaign structure, verify that every conversion action is firing correctly, that enhanced conversions are enabled, and that the attribution model reflects actual business value. Optimising on bad data does not slow down waste; it accelerates it in the wrong direction.
Conclusion
The data does not lie, but it does require the right lens to interpret it correctly. Here is what 2026 is making clear: old assumptions are costing advertisers real money, AI-driven bidding demands smarter inputs not less oversight, audience signals now matter more than keyword lists alone, and return on ad spend is increasingly determined by how well you read your numbers rather than how much you spend.
The gap between informed advertisers and everyone else will only widen from here. You now have the evidence you need to close that gap.
Audit your campaigns through this new lens, challenge the metrics you have always trusted, and make decisions grounded in current data. The advertisers who thrive in this environment are not the ones with the biggest budgets. They are the ones paying closest attention.
Start paying closer attention today.